Pages

Labels

Thursday, March 13, 2008

Grace and Relationship With God

I received an email from a reader which (with the reader's permission) I would like to open up for suggestions. She gives the following background about herself:
A little background… I was raised Catholic and knew the "list" of things to do and not to do, but not the "whys". I didn't even know the church still used a catechism until about two years ago and I went to Catholic schools and university, I'm in my early thirties now. When I went to grad school I was invited to join a campus Bible study/service group. For the first time I felt I was part of an active Christian community. Unfortunately, I didn't realize that it was part of the International Churches of Christ/Boston Movement. I am actually a fairly intelligent person, but in my ignorance, zeal and naivety I joined what I now consider a very unhealthy church borderline cult. I finally left six years later depressed, with a shattered faith and a mild case of post-traumatic stress disorder. After some counseling, group therapy, a move across the country, and time I finally started re-examining my spiritual roots.

Over the last three years I've been reading a lot and in the last year have been seriously considering returning to the Catholic Church. I don't have any serious Catholic friends and my Christian friends think I'm at best a bit crazy and at worst jeopardizing my soul for even contemplating this. I did talk to a priest soon after I left, but it went horribly. I couldn't bring myself to step into a church again for over a year. It's only been recently that I've decided to try again.
The difficulty she's grappling with is building a correct understanding of our proper relationship with God, and including a correct understanding of sin and grace:
I don't know if you know anything about the ICOC, it was a spin off the mainline Churches of Christ. It was a young and vibrant fellowship, filled with immaturity and zealots. Everyone was called to live the same radical Christian life, which meant daily Bible studies, evangelism, fellowship, willingness to give up anything, etc (I know these are good things in right practice, but this was not that). And if you weren't "fired up" enough and being sacrificial enough well then you were ungrateful, lukewarm, and didn't care about the Lost, so then you were thoroughly rebuked with the appropriate scripture, even if it had to be pulled out of context. When you joined you didn't receive this treatment, only slowly as time passed and before you know it you wonder how you ended up in that place. It was truly emotional abuse tied up in your spiritual identity. At some point I knew no matter how much I tried to twist my personality into their "ideal" I couldn't, so I constantly felt that I was a disappointment to God and emotionally detached.
And she asks:
So I guess my question as best I can formulate it right now, is might you have any ideas of how I could proceed in getting a correct balanced view of God, perhaps a certain book or author? Or any other comments/suggestions you might think useful for me. The only advice I've gotten so far is "fake it till you make it", or "just trust God and it'll work out".
Does anyone have specific books, resources or authors to recommend dealing with these kind of issues from the Catholic perspective? I think some good resources on the proper place of the sacraments in our relationship with God and dealing with sin would probably be key, but I can't think of anything right off to recommend.

Czech President on CO2 Emissions

Czech President Vaclav Klaus made news last week by giving a speech in which he "questioned global warming". He may do that as well (I know next to nothing about him and his positions) but the extract from his speech which I ran across in The Australian yesterday is more on the economic difficulties of actually reducing emissions. These arguments may be familiar, but they struck me as fairly well made in this instance, and it also struck me as significant coming from the leader of a nation which is still working to rebuilt itself after communist rule.
I recently looked at the European CO2 emissions data covering the period 1990-2005, the Kyoto protocol era. You don't need huge computer models to very easily distinguish three different types of countries in Europe.

In the less developed countries, Greece, Ireland, Portugal and Spain, which during this period were trying to catch up with the economic performance of the more developed EU countries, rapid economic growth led to a 53 per cent increase in CO2 emissions. In the post-communist countries, which went through a radical economic restructuring with the heavy industry disappearing, GDP drastically declined. These countries decreased their CO2 emissions in the same period by 32 per cent. In the EU's slow-growing if not stagnating countries (excluding Germany where its difficult to eliminate the impact of the fact that the east German economy almost ceased to exist in that period) CO2 emissions increased by 4 per cent.

The huge differences in these three figures are fascinating. And yet there is a dream among European politicians to reduce CO2 emissions for the entire EU by 30 per cent in the next 13 years compared to the 1990 level.

What does it mean? Do they assume that all countries would undergo a similar economic shock as was experienced by the central and eastern European countries after the fall of communism? Do they assume that economically weaker countries will stop their catching-up process? Do they intend to organise a decrease in the number of people living in Europe? Or do they expect a technological revolution of unheard-of proportions?
It's often said that global warming will hit the poorest the hardest. That statement, however, overlooks the fact that any proposal with a realistic prospect of reducing CO2 emissions at a global level would also hit the poorest countries the hardest.

President Klaus also has what strikes me as a healthy respect for the difficulty of master planning systems:
What I see in Europe, the US and other countries is a powerful combination of irresponsibility and wishful thinking together with the strong belief in the possibility of changing the economic nature of things through a radical political project.

This brings me to politics. As a politician who personally experienced communist central planning of all kinds of human activities, I feel obliged to bring back the already almost forgotten arguments used in the famous plan-versus-market debate in the 1930s in economic theory (between Mises and Hayek on the one side and Lange and Lerner on the other), the arguments we had been using for decades until the moment of the fall of communism. The innocence with which climate alarmists and their fellow-travellers in politics and media now present and justify their ambitions to mastermind human society belongs to the same fatal conceit. To my great despair, this is not sufficiently challenged, neither in the field of social sciences, nor in the field of climatology.

The climate alarmists believe in their own omnipotency, in knowing better than millions of rationally behaving men and women what is right or wrong. They believe in their own ability to assemble all relevant data into their Central Climate Change Regulatory Office equipped with huge supercomputers, in the possibility of giving adequate instructions to hundreds of millions of individuals and institutions.

We have to restart the discussion about the very nature of government and about the relationship between the individual and society. We need to learn the uncompromising lesson from the inevitable collapse of communism 18 years ago. It is not about climatology. It is about freedom.
This does not necessarily mean a refusal to do anything to be responsible about one's environmental impact, I think, but it does point out the inherent problem that comes about when very smart people decide to make the world better: They may know a great deal, but seldom as much as they think.

Our Weekly Bread

A while back, Julie D's food blog Meanwhile, Back in the Kitchen linked to a photo essay in Time Magazine called "What the World Eats". It's a fascinating look at what people around the world eat in a week, and how much they pay for it.

There's probably enough gustatorial diversity in America to make up a separate study, as evidenced by my looking at the two American families featured and thinking, "That doesn't look anything like the way our family eats." And so as an experiment I offer a photo of last week's shopping.

The Darwins, Round Rock, TX
Total for this trip: $112.44
(not pictured: mid-week run to store, bringing weekly total to close to $130)

Now obviously this isn't everything we eat in a week. It doesn't take into account things already in the pantry, like refried beans or flour for the pizza or the farm eggs from the chickens that Darwin's manager raises. But it is a fairly accurate picture of how we shop for food (as this was a trip in which I didn't have to buy diapers, wipes, laundry detergent, or a new broom). We don't tend to buy packaged snacks (the pretzels were an impulse buy after a request from the ladies) or prepared meals, and we don't often eat fast-food or go to restaurants.

I'm curious as to how other families eat. I'll tag anyone who's interested to participate in my informal shopping photo documentary.

Wednesday, March 12, 2008

Jen's new address

Et tu, Jen? has a new URL: http://www.conversiondiary.com/ . The old address isn't redirecting so well, so if you're one of her readers you'll want to update your bookmarks and/or links.

Tuesday, March 11, 2008

Inequality, Mobility and Family Size

There was a pretty solid piece in the WSJ yesterday about income inequality and family size in the US. It's fairly often stated (especially in election years) that all of the income growth in our economy goes to the "rich", while the poor are left behind. One of the standard ways of proving this is pointing to the Census Bureau's five income quartiles and observing that in inflation adjusted dollars the bottom quintile of households has seen a flat upper limit income since 1970 (22k to 25k from 1970 to 2006).

Schiller's WSJ piece points out that the household income figures mask a huge change in American society during those 35 years.
The "typical" household, however, keeps changing. Since 1970 there has been a dramatic rise in divorced, never-married and single-person households. Back in 1970, the married Ozzie and Harriet family was the norm: 71% of all U.S. households were two-parent families. Now the ratio is only 51%. In the process of this social revolution, the average household size has shrunk to 2.57 persons from 3.14 -- a drop of 18%. The meaning? Even a "stagnant" average household income implies a higher standard of living for the average household member.

Last year, the Census Bureau published a new set of income statistics that adjusted for changing household size and composition. In a single year (2006), this "equivalence-adjusted" computation increased the income share of the poor by 8% and reduced the standard measure of inequality (Gini coefficient) by 4%. Such "equivalency" adjustments would mute unadjusted inequality trends even more.

A closer look at household trends reveals that the percentage of one-person households has jumped to 27% from 17%. That's right: More than one out of four U.S. households now has only one occupant. Who are these people? Overwhelmingly, they are Generation Xers whose good jobs and high pay have permitted them to move out of their parental homes and establish their own residences. The rest are largely seniors who have enough savings and income to escape from their grandchildren and enjoy the serenity of an independent household. Both transitions are evidence of rising affluence, not increasing hardship. Yet this splintering of the extended family exerts strong downward statistical pressure on the average income of U.S. households.
This reminded me of a discussion of household income inequality I'd heard on the EconTalk webcast in which Thomas Sowell was interviewed about his book Economic Facts and Fallacies. He also talked about the household income quintiles, and observed that the difference in household size between to top and bottom quintiles was so stark that there are 39 million people in the bottom 20% of households while there are 64 million people in the top 20%. I haven't been able to find data in some quick browsing around the Census Bureau to dig into that more, but I do recall from looking into poverty stats that the poverty rate for married households is around 5%, for families in general it's about 10%, and for "female householder with no male present" households is 30%.

Another thing that Schiller points out is that the membership in these income quintiles is far from static. There was a great WSJ piece on this a while back which discussed a study comparing 1996 and 2005 tax returns by income quintile. I've included the basic chart from that article at the left, but it's worth reading. This ties pretty well with my own experience of the last ten years.

Sunday, March 9, 2008

Why I hate Daylight Savings Time

I put a fancy-schmancy coffee cake in the oven this morning and settled down to surf the 'net and see what the news was. In passing I see a note about Daylight Savings Time. "What?" says Darwin. "It's not Daylight Savings Time yet, is it?"

"No, of course not," I laugh.

"Well, hon, the clock in the kitchen says 9:10, and the clock on the computer says 10:10."

I swear this happens every year. Good thing Mass isn't until 11:30...

Thursday, March 6, 2008

Poverty and Abortion: A New Analysis

There has, for some time now, been an argument floating around out there (mostly among progressive-minded pro-lifers) that perhaps electing pro-choice Democrats is actually more useful in reducing abortion than electing pro-life Republicans, because Democrats reduce poverty and poverty is is tied to abortion. Among Catholic blogs, Vox Nova writer Mornings Minion wrote a statistical analysis of sorts six months back which he continues to point to as proving strong connection between poverty and abortion. In the wider world, Fuller Theological Seminary ethicist Glen Harold Stassen authored a pair of articles back in 2004 arguing (based on what later proved to be drastically incomplete data) that the number of abortions had risen under George W. Bush, and attributing this to Bush's economic policies. Stassen's analysis was then quoted (with rapidly decreasing degrees of accuracy) by Hillary Clinton, John Kerry and finally Howard Dean, who asserted that abortions have gone up 25% under Bush. (see above link to FactCheck.org)

Once it became clear that the data did not even remotely support the claim that abortion had increased under Bush, Stassen and others fell back on asserting that while it was true that the overall drop in abortion rates had continued under Bush, that the rate of its decrease had slowed, and that this was the result of an increase in poverty under Bush.

Now from a moral point of view, I think one must conclude that the point is irrelevant. Individual human beings are moral agents and as such, although they may find themselves under huge temptation to sin based on external pressures, they are free to choose right or wrong action. Thus, while it may be that in a period of relative prosperity people feel less pressure to commit certain crimes and/or sins, we must not see the duty of society to be simply to make sure everyone is too wealthy to want to sin; rather society must retain a strong enough moral sense to encourage right behavior in good times and in bad.

However, after hearing this argument one too many times, I decided to go dig into the data and see if even the strictly factual side of it is true. So far as I can tell, the argument has the following components:

1) Economic well-being (as measured by a low poverty rate and a high median income) has been greater under Democratic administrations than Republican ones in the last 30 years.

2) Abortion rates have either been lower or have decreased faster under Clinton than under Reagan, HW Bush or W Bush.

3) There is a strong correlation between economic well-being and the abortion rate.

I'm going to argue that all of these are partly or wholly false.

First, let's look at how the percentage of individuals below the poverty rate has fluctuated since 1976:

I've marked out the presidential administration on the chart, and I also marked the 1996 welfare reform act, since that appeared to align with an inflection point. It may also be worth noting that according to the National Bureau of Economic Research, there were recession troughs on July 1980, November 1982, March 1991 and November 2001. (Data drawn from US Census data here and here.)

Now let's look at the percentage of individuals below the poverty line, the percentage of families below the poverty line, and the median household income for the last four administrations:
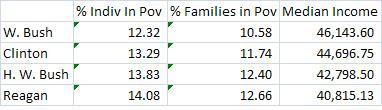
As you can see, what we have is a steadily improving economic trend throughout the period. You can argue that the Clinton administration provided a better economy than Reagan and H. W. Bush did, but only if you concede that W. Bush has done an even better job than Clinton. (It is, of course, possible that the 2007 and 2008 years will put Bush below Clinton, but it seems unlikely that the economy will get bad enough this year to counteract the weight of the early Clinton years. At most, it will make the Bush administration less of an improvement over the Clinton one.) Going back farther, Carter and Nixon/Ford had the lowest poverty rates of any recent president(~11.9%), while JFK/LBJ had by far the highest (~17.5%). The does not seem to be any clear correlation between administration party and economic well being. Instead, the macro trend is that poverty has been steadily declining and median income has been steadily rising throughout the period since 1960.

Let us turn now to abortion rates and any correlation they may show with economic data. The Guttmacher Institute is generally considered the most reliable source for data on abortion in the United States. They are somewhat affiliated with Planned Parenthood, but their data is used and respected by those on both sides of the abortion debate. In their data they provide two statistics which are population-adjusted: Abortion Rate and Abortion Ratio. The former is the number of abortions per 1,000 women aged 15-44. The later is the percentage of pregnancies (which end in either live birth or intentional abortion) which ended in abortion. Thus, the rate gives us a good idea of the population-adjusted frequency of abortion within society, while the ratio allows us to control for lower incidence of pregnancy due to contraception. (Guttmacher data below is drawn from this study.)

The macro trend in abortion rate and ratio is that abortion skyrocketed from 1973 (when Roe v. Wade effectively removed nearly all abortion regulation) through 1980, when both flattened off and began to drop. In 1980, 30% of all pregnancies ended in abortion.

The graph above selects data from 1980 through 2006. I'm assuming that the rapid increase in abortions from 1973 is the result of increasing social acceptance and availability, and thus can not be expected to correlate to any factor under examination other than availability and lack of regulation.

As you can see, the downward trend in abortion ratio and rate is very clear. I've plotted the rate against a simple linear trendline, and the relation between these shows an R-Squared of 0.96. The trend for the poverty rate is also downwards from 1980 to 2006, but the slope is much more gentle and the correlation to a simple linear trendline is much lower (0.5). It would be most accurate to say that the poverty rate is oscillating with a slight downward trend. Yes, there is something of a correlation between the abortion rate and ratio and the poverty rate, but only to the extent that both are generally trending downward.

Let's try to get a good visual feel for this. On the top chart, I've plotted the abortion rate against the poverty rate. The RSQ is .47. On the bottom chart, I've charted the abortion rate against the number of years since 1980. The RSQ is .96.


So, based on the trends of the last 25 years, if you wanted to successfully predict what the abortion rate will be in a given year, you're going to be far more accurate if you base your projection on the relation between the number of years since 1980 than if you base it on the poverty rate.

But let's try something else. Say that we look at all the periods during which the poverty rate was going up and see if the abortion rate went up or went down less in those years. The following chart selects the three periods since 1979 when the poverty rate went up year over year.

The trend is actually very interesting. As the poverty rate was rising sharply from 1979 through 1982, the abortion rate dropped. The same thing happened during the poverty rate rises of 1990-1993 and 2001-2004. Even more interesting, however, is that during these first two downturns, although the abortion rate levelled in the first case and continued dropping in the second, the abortion ratio increased during both of those periods. What that means is that although women were not getting abortions at a higher rate during these periods, they were conceiving at a higher rate. People avoided pregnancy at a higher rate (thus decreasing the number of planned pregnancies) but did not abort at a higher rate.

If people were aborting more because of the rise in poverty, one would expect to see the actual abortion rate go up during these periods. Instead, we see that people avoided pregnancy (thus decreasing the percentage of total pregnancies which were "planned pregnancies") but actually reduced the rate at which they aborted.

Perhaps because the increase in poverty under the current administration has not been as severe, as those in the early 80s and early 90s, there has been no rise in either the abortion rate or ratio during that increase in poverty rate.

But has the rate of decline in the abortion rate and ratio slowed under Bush as compared to Clinton?

At first it might appear so. During the Clinton administration the abortion rate declined an average of 0.55% per year, versus 0.38% per year from 2001 to 2005 (more current data is not yet available from Guttmacher.) However, something interesting appears when we look at the abortion ratio, which has declined more rapidly under Bush than under Clinton. So the apparent Clinton advantage is a result of an overall decrease in pregnancy under Clinton. If we control that by looking at the ratio (the percentage of pregnant women who abort) we find that it has actually declined faster under Bush than under Clinton.

This got me interested in looking at how the pregnancy rate and the abortion ratio are related. I used the abortion ratio and the total number of abortions from the Guttmacher data and combined them with the annual total population figures from the Census Bureau. To get a roughly accurate female population figure, I divided the US population in half. Then I used the abortion ratio and the total number of abortions to calculate the total number of pregnancies, and I divided those by the female population to get a pregnancy rate. (One of the reasons this rate runs so low is that this would be total female population, not just the female population of childbearing age.) I charted these two rates below. (Note that this chart flows in the opposite direction from the others in regards to date.)

This perhaps begins to hint at some of the real causes of abortion trends over the last thirty years. Note that right after Roe the pregnancy rate increases by 25% over eight years. During the same period, the abortion ratio increases 50%. In effect, by decreasing the obstacles to ending an unwanted pregnancy, Roe significantly increased the number of unwanted pregnancies, resulting, in fact, in a net increase in births. As the abortion ratio has consistently fallen over the last twenty years, the total number of pregnancies has fallen back into a more normal trendline.

Why has abortion really been falling? I think it's significant that the abortion rate is falling in such a tight correlation to the number of years since the peak. This indicates, it seems, some sort of self-correcting mechanism going on. Perhaps it's partly a re-introduction of restrictions on abortion, both cultural and legal. Perhaps it's partly a build-up of painful experience, which has overcome the initial impression that the costs of getting pregnant (and getting out of getting pregnant) are not as high as they were before 1973. Either way, it seems that some force that is building with time is continuing to drive the abortion rate down without any current signs of slowing.